

Graphics by Lydia Qu
The BRB Bottomline: According to recent research published by the Brookings Institute, Carnegie Endowment, and Princeton University, China’s reported economic growth could be systematically inflated by as much as five percentage points due to reporting incentives. Aggregate macroeconomic statistics are estimates, at best, though this article explains the misaligned incentives and financial implications that overreporting has on Chinese and global economic stability.
Some Context
Despite recent metrics around the globe showing severe production declines as a result of coronavirus, Chinese GDP growth continues to be one of the fastest among developed and developing nations. That’s not a new story. While the rest of the world experienced recessions and layoffs, China blew through the 2008-2012 years, reaching an all-time productivity growth peak of 11 percent in 2011. By all official accounts, China is on track to surpass aggregate U.S. output and take the mantle of economic hegemony within the next several decades.
However, recent research by several independent teams point to a different story. Namely, a story of mismanagement and inflation that worked side-by-side with growth to transform moderate economic gains into a staggering success narrative. A recent study by Brookings found that the discrepancy between actual and reported aggregate Chinese GDP was upwards of five percentage points between the periods 2006-2018. Much of this GDP gap has been attributed to three primary factors: local productivity data being skewed by bureaucratic competition, national data collection failing to account for inconsistent metrics, and consumption spending being aggressively overestimated. As one report from the Carnegie Endowment put it bluntly, “In China, however, when reported growth comes in above consensus expectations, it does not imply a stronger economy.”
First, I will explain how China’s current GDP data collection process works. Then, I will discuss the three aforementioned reasons for discrepancies. I will conclude with a few suggestions on interpreting Chinese GDP calculations and what overestimates might be doing to international financial markets. My hope is that this clear organization of the facts allows the structural argument of the article to be read without a political angle.
Calculation Methods
Given the population and infrastructure limitations of China, methods for collecting economic data for GDP calculations vary greatly from U.S. methods. The Chinese National Bureau of Statistics (NBS) lacks the bureaucratic reach to perform localized data collection. It therefore relies on output metrics collected at the local level. According to the same study by the Brookings Institute, “The NBS uses the same data collected and used by local governments, along with the data it collects independently, to arrive at a number for national GDP.” While the NBS has faced criticism for poor data analysis and misreporting, experts believe the root of most GDP inflation stems from local reporting mechanisms.
After local data is compiled with the NBS, it undergoes a series of manipulations and adjustments to align local reports with NBS internal analyses. While the government itself has said adjustments play a role in the final GDP estimate, reports vary on the size and scale of these adjustments and whether they are politically motivated. According to one critic at the American Economic Institute, the NBS functions as a “Communist Party organ first and an honest statistical broker second,” while others prefer to place statistical discrepancies on local bureaucratic initiatives and geographic scope.
Bureaucratic Posturing
Disregarding for a moment the accusations against NBS methodology, there is little debate in research circles beyond the Chinese government that local municipalities contribute to inflated GDP estimates. The Brookings Institute paper concluded that while local GDP was actually slightly underreported by local governments throughout the 1990s, “there is abundant evidence that local data on gross investment has become more unreliable.”
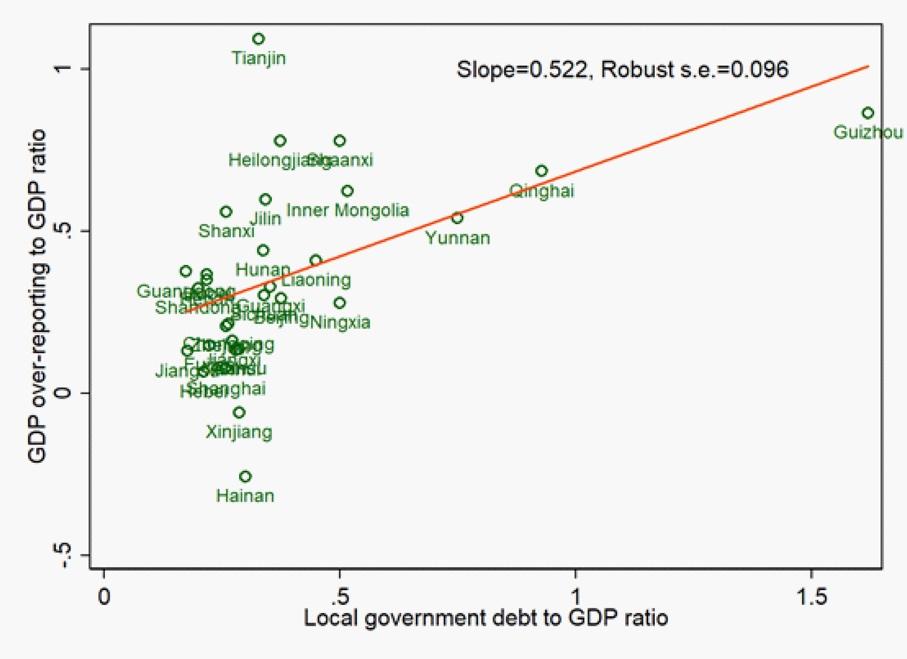
A 2019 report by Wei Xiong, published by Princeton University, shows a causal relationship between career incentives for local bureaucrats and higher GDP overreporting and financial short termism. “To incentivize regional leaders, the central government has established a tournament among officials across regions at the same level, promoting those achieving fast economic growth and penalizing those with poor performance,” says Xiong. He further reflects that these central government initiatives have a powerful effect on overreporting, as “career concerns” heavily influence governors and other bureaucrats to skew analysis for political benefit. And, as local governments determine over 70% of fiscal spending of China and control local economic frameworks, central governments initiatives are severely skewing statistical analysis.
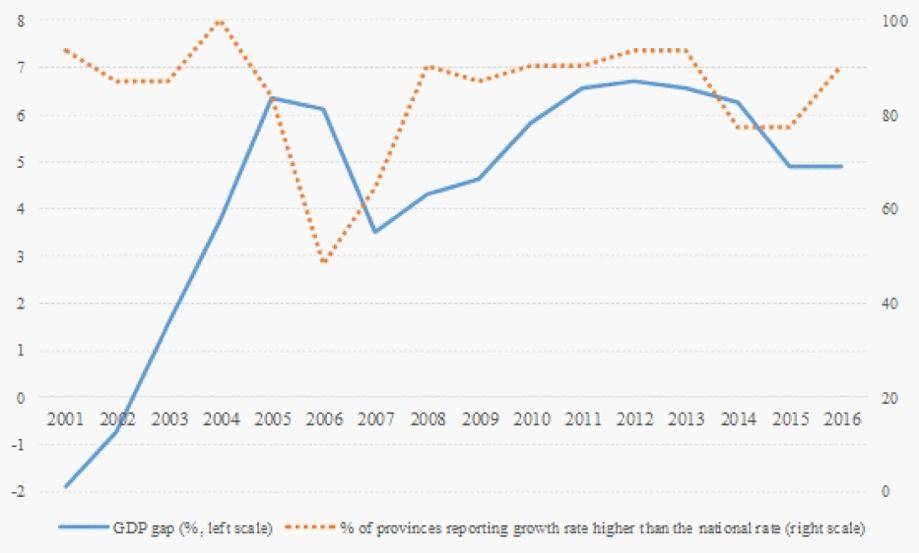
The graphs below from Xiong’s paper reveal two central features of what provincial-level data skewing looks like. The first (Figure A) shows how provincial skewing is correlated, shown with a positive slope, to local debt ratios and percentage of total GDP. Figure B reveals that overreporting is skewed heavily towards the local level, as most provinces consistently report GDP above national GDP levels. The finding from Figure B is consistent with findings from the Brookings Institute, which claims “the sum of local GDP frequently exceeds national GDP.” The majority of this manipulation, however, is focused in one specific area of output: industrial production.
Industrial Production Reporting
As noted above, the majority of misreporting in Chinese data is attributed to industrial output inflation, while discrepancies in import and export data further distort actual figures. Industrial overreporting makes sense if we think about it from the perspective of local reporting. Industrial metrics are more quantifiable than service sector metrics and are harder to check than consumer spending metrics. Additionally, trade balance manipulations, particularly of imports, are harder to track from the perspective of international fact checkers and are a relatively discrete way to build up output metrics without affecting other data inputs.
The Brookings Institute’s breakdown revealed discrepancies in industrial output reporting by comparing industrial value-added tax growth against industrial GDP growth over the same time periods. The study found that “the average industrial value-added tax revenue growth was about 5.3 percent between 2009 and 2016, which is about 3.4 percentage points lower than the average industrial GDP growth in the same period.” The findings indicate a discrepancy between tax revenue and output data which strongly suggests local reporting is heavily skewing industrial statistics above reported metrics.
The study also found noticeable discrepancies between national and local investment data. The analysis compared provincial reports on fixed-capital formation (FCF)—a proxy for industrial investment—with their national counterpart: fixed-asset investments (FAI). The report concluded that “The enormous gap between FAI and FCF suggests that investment spending is overstated by local statistical offices and that the NBS has made large adjustments to these data to arrive at a number for aggregate net investment.”
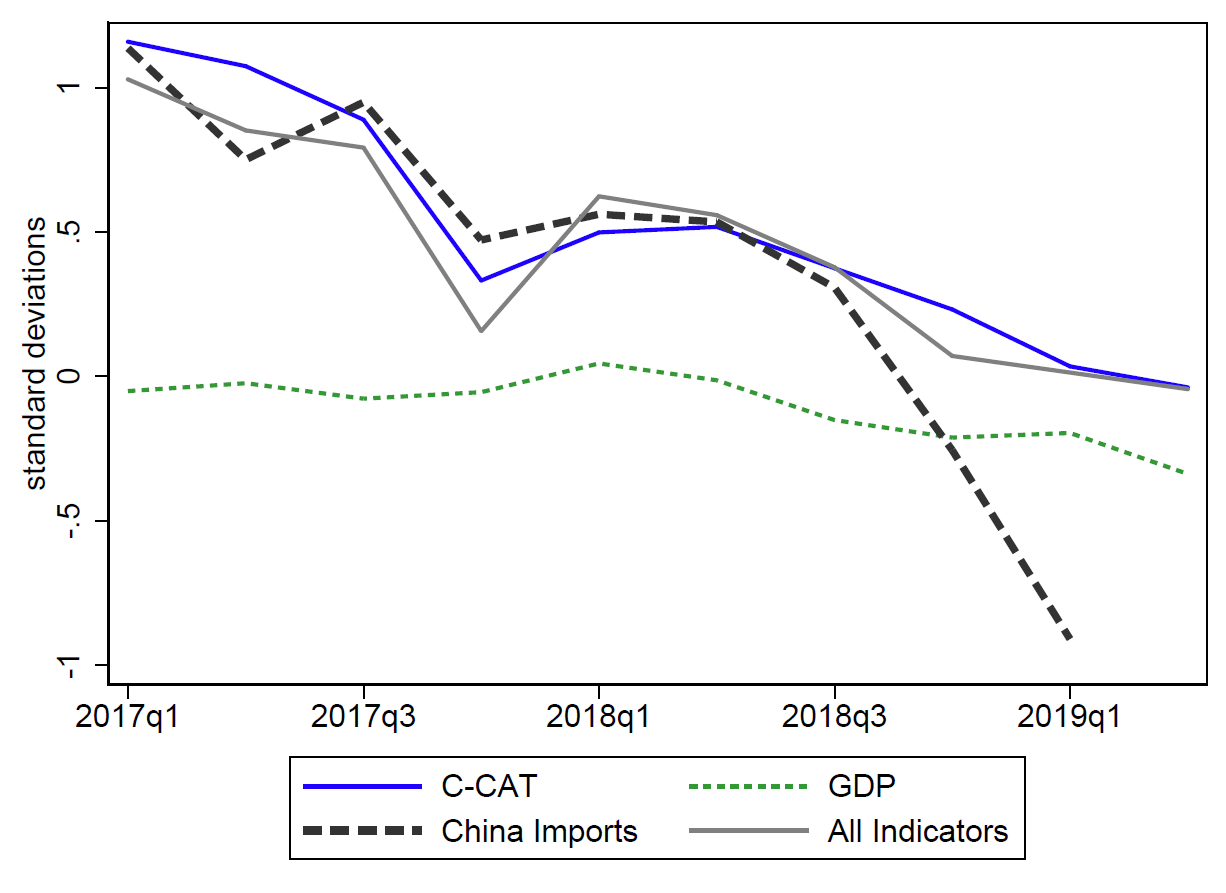
Econometric analysis in an August 2019 report by the Federal Reserve further found import data was statistically less strongly correlated with overall output data than other output indicators, suggesting tampering of import metrics. Namely, import data did not follow the same linear pattern of GDP “slowing off” beginning in 2013 but rather declined at a far more substantive rate than other indicators without having a noticeable positive impact on GDP.
The discrepancy can be noticed in Figure C below, which identifies import data along the dotted line, which remains close but slightly differentiated from both GDP and other indicator fluctuations. The study concluded that,“the relationship of reported GDP with either the activity factor or imports is less strong,” though did not extrapolate this to necessarily indicate intentional misreporting.
Operating in a Misrepresented Market
Chinese officials are certainly not oblivious to the reality of gross output misreporting. Premier of the State Council of the PRC, Li Keqiang, allegedly advised the use of alternate growth indicators to provide a more realistic impression of economic well-being and stated, “All other figures, especially GDP statistics, are for reference only.” Premier Keqiang instead focused international community’s attention on three alternative indicators: electricity consumption, rail cargo, and loan distribution rates. While not all of these indicators hold up under rigorous analysis, Keqiang’s use of outside indicators provides important insight for investors and policymakers dealing with questionable official data.
Before suggesting other alternative metrics for measuring Chinese growth, we must first dispel the use of what a report by the American Economic Institute (AEI) called “Bad Alternatives.”
First, are stock market metrics, which fail to capture real growth namely because, according to the AEI, Chinese corporate reports are “notoriously unreliable.” Chinese companies are well known for using tax havens and legal loopholes to obscure their direct investments, particularly those abroad. Because these mechanisms are often lightly or selectively policed, company accounting books in China are treated as suspect by a large portion of outside investors.
A more popular alternative is to adjust Chinese growth using purchasing power parity (PPP), which is designed to provide a comparative understanding of growth across nations by using adjusted baskets of goods. This approach has two problems. Unlike the US, China’s economy varies greatly based on geographic region. Assigning one goods basket to the country likely oversimplifies any adjustments. On top of this, Chinese consumer consumption makes up a small portion of GDP relative to other developed nations, which means PPP—purchasing price parity— has a less powerful effect as an adjustment tool than in an economy like the US.
However, both the AEI and Federal Reserve point to several promising alternatives to accepting GDP at face value. The AEI tentatively defends the use of credit-wealth analyses that track total income, particularly based on the independent reporting of Credit Suisse since 2017. The report more strongly supports an analysis of total debt as an indicator of investment and growth. By contrast, the Fed seemed more responsive to one of Keqiang’s indicators, finding “that electricity usage emerges as our best-fitting individual indicator with estimation conducted over our full sample.”
Both the Reserve and AEI agreed that the use of externally-sourced import and export data was perhaps the best alternative to GDP growth. Because this data is gathered independent of Chinese state structures, it is not liable to misrepresentation. And while it fails to provide a full scope of economic well-being, the Fed paper states, “inflation-adjusted imports (measured using trading-partner-reported exports) can serve as a reliable high-frequency measure of fluctuations.”
All this is to say that while there remains a deficit in official internal alternatives to GDP reports, the intelligent investor or interested onlooker would be remiss not to use alternative indicators of Chinese economic strength to get a fuller understanding of the economy’s health.
Take Home Points
Given the practical challenges of collecting accurate macroeconomic data, resolving production overreporting in China isn’t likely. Even if a better system could be designed, incentives for overreporting would likely persist. That situation is made all the more intransigent by multiple reports from senior Chinese officials who have disregarded data discrepancies as irrelevant as long as growth continues to be positive.
The fallout from coronavirus is likely to increase scrutiny in academic and policy circles over the true economic growth rate of China and how it stacks up against NATO economies. While trade across borders will undoubtedly fall in light of severe travel restrictions and stay-at-home orders, domestic production reported by provincial governments may still continue. Internal incentives to show good stewardship and numbers in the crisis could exaggerate past trends of local overreporting.
Chinese economic growth was undoubtedly strong in the early part of the 21st century, and a report from the Federal Reserve found GDP metrics grew more accurate in the wake of the 2008 Crisis, but also concluded that the “Great Moderation,” or recent Chinese GDP slowing which the government claims is a result of stabilization, “is largely spurious.” Understanding discrepancies in reporting can therefore reveal larger trends in relative economic power than does accepting official data at face value.
For the intelligent investor, businessperson, and policymaker, it is perhaps best to approach Chinese GDP statistics like the friend of a friend. Sure, they might have good intentions and heart, and, of course, some of what they say is certainly true. But it’s always best to do some independent digging before you pledge away your confidence and trust to someone you don’t know too much about.
In the same way, Chinese output calculations are somewhat valid indicators of economic well-being and growth, but it is imperative to rely on independent reporting and additional indicators to gain a more accurate insight into the reality of Chinese growth metrics.